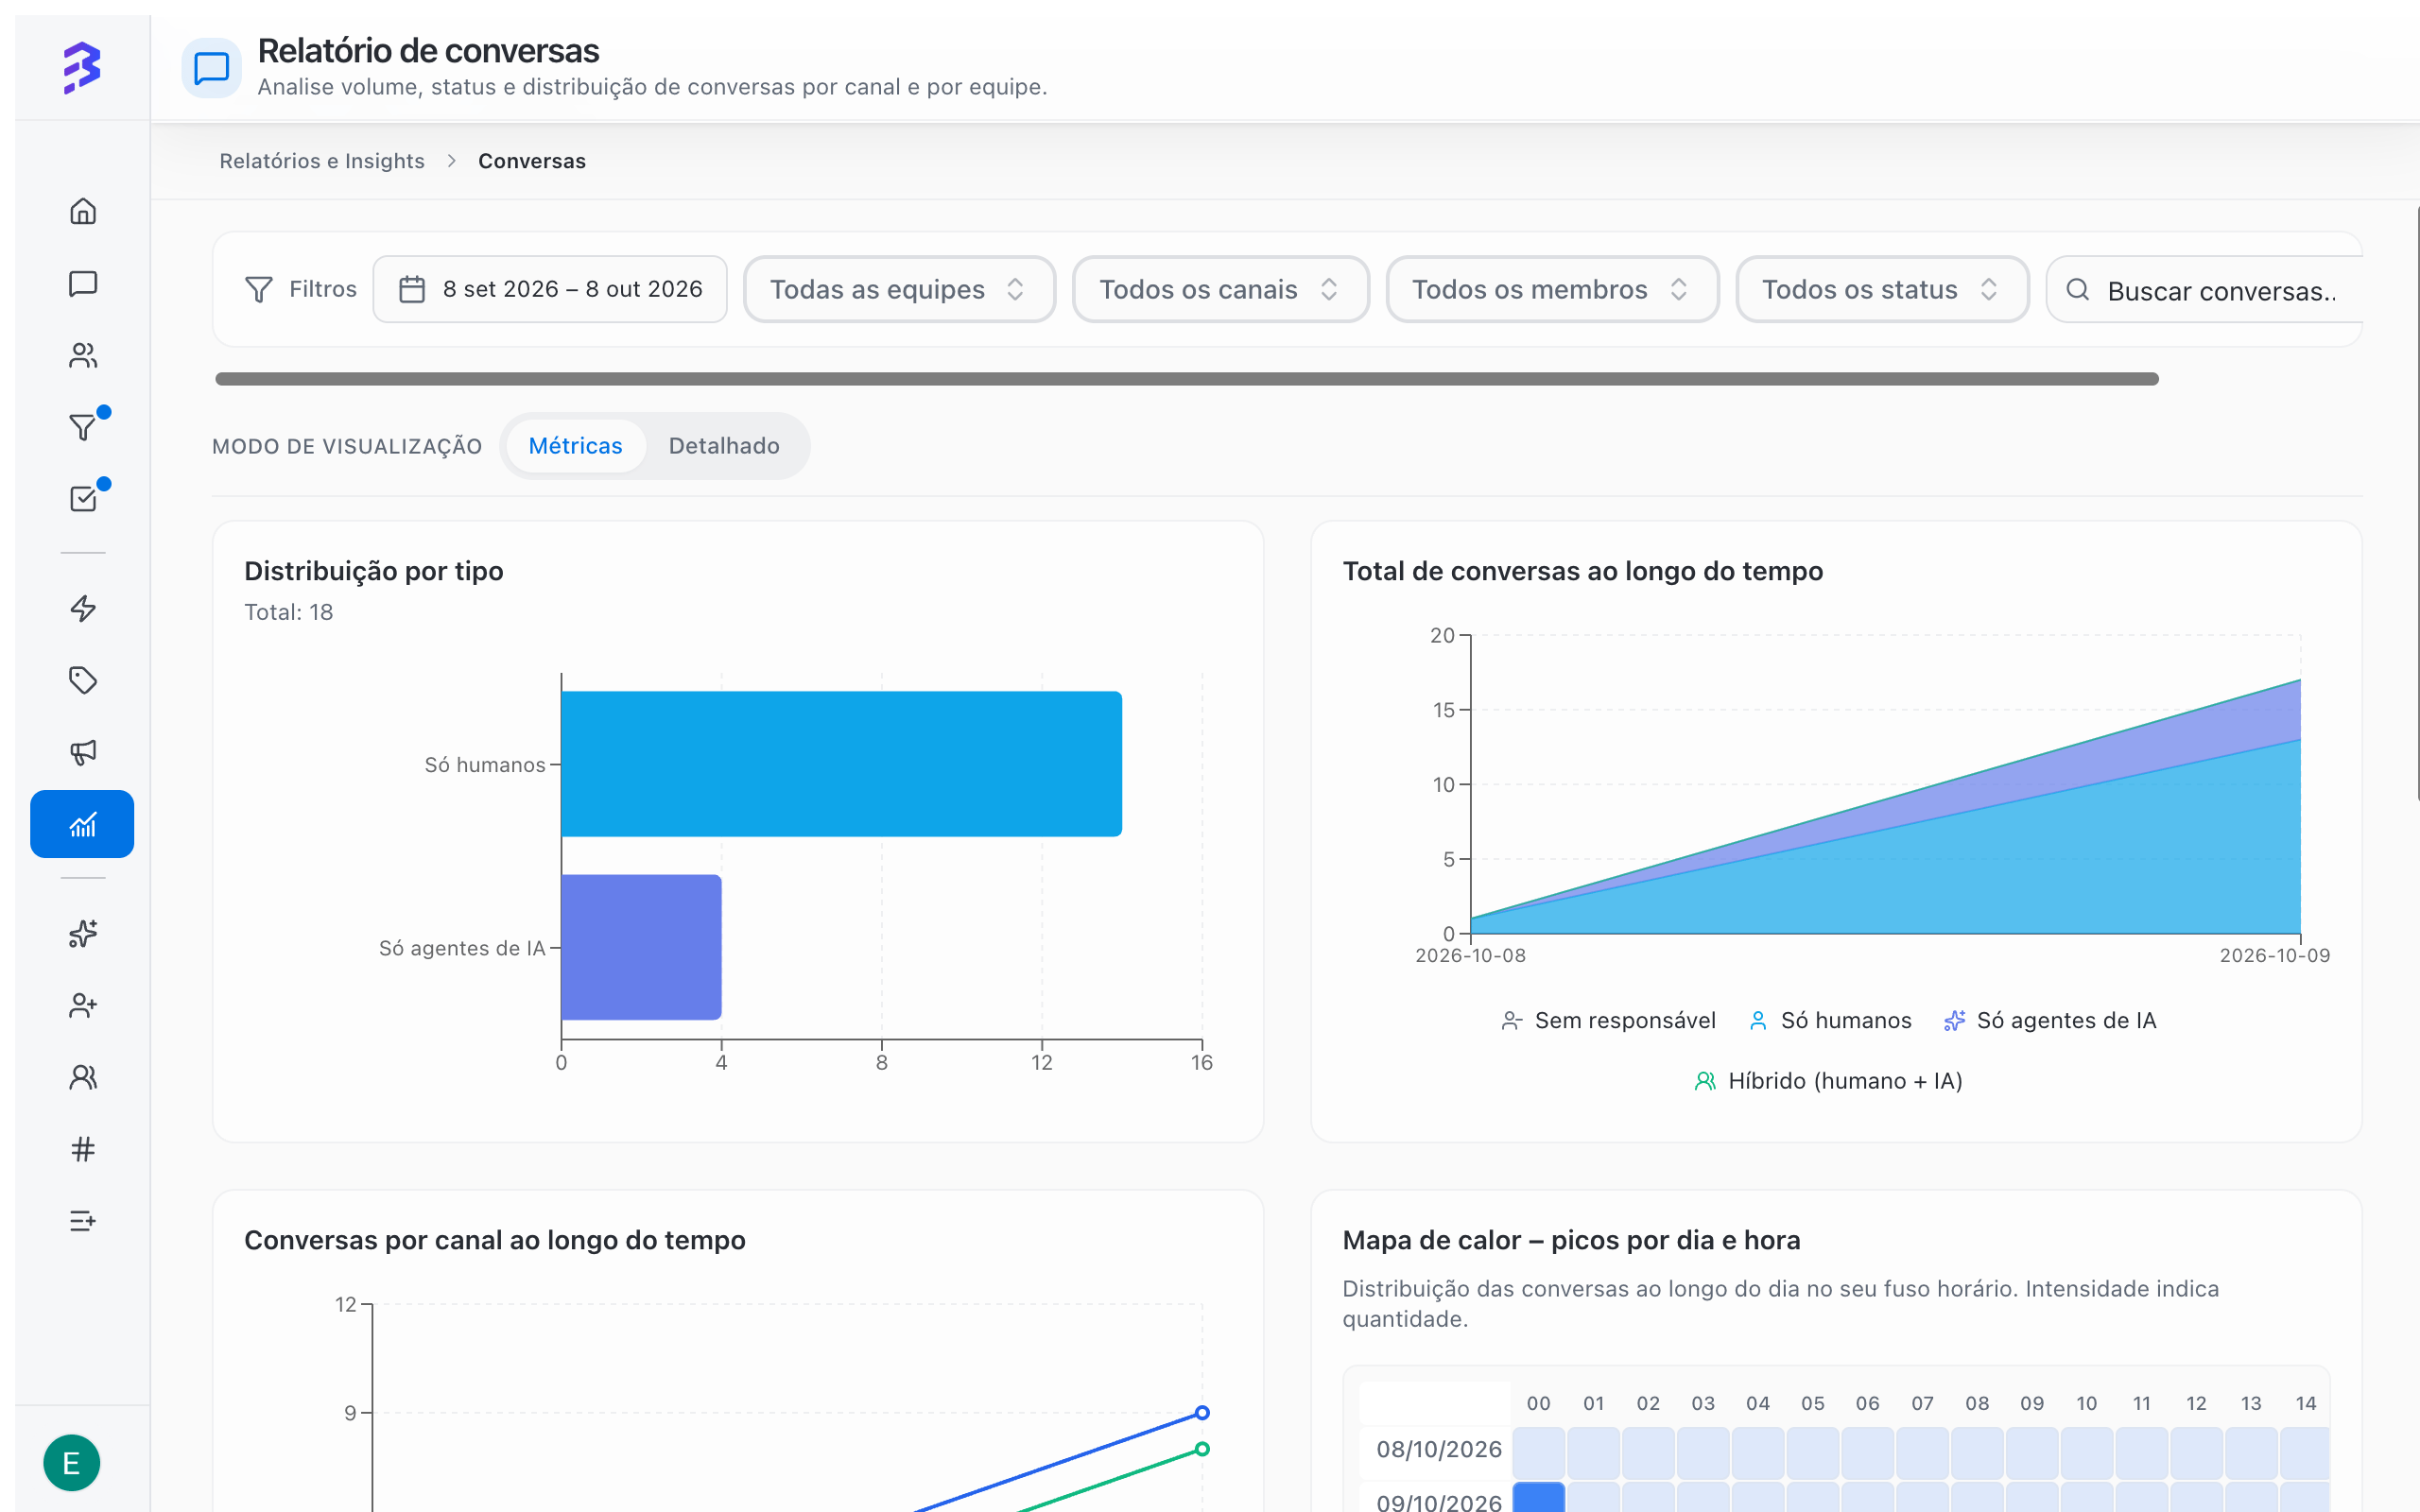
Filters
The filters sit at the top and apply to both view modes.
Click Refresh to reload the data. Managers only see the teams they belong to and those teams’ channels.
Period indicators
View modes
Use View mode to switch between:- Metrics: charts and indicators for the period.
- Detailed: a table with one row per conversation.
Metrics mode charts
Detailed mode table
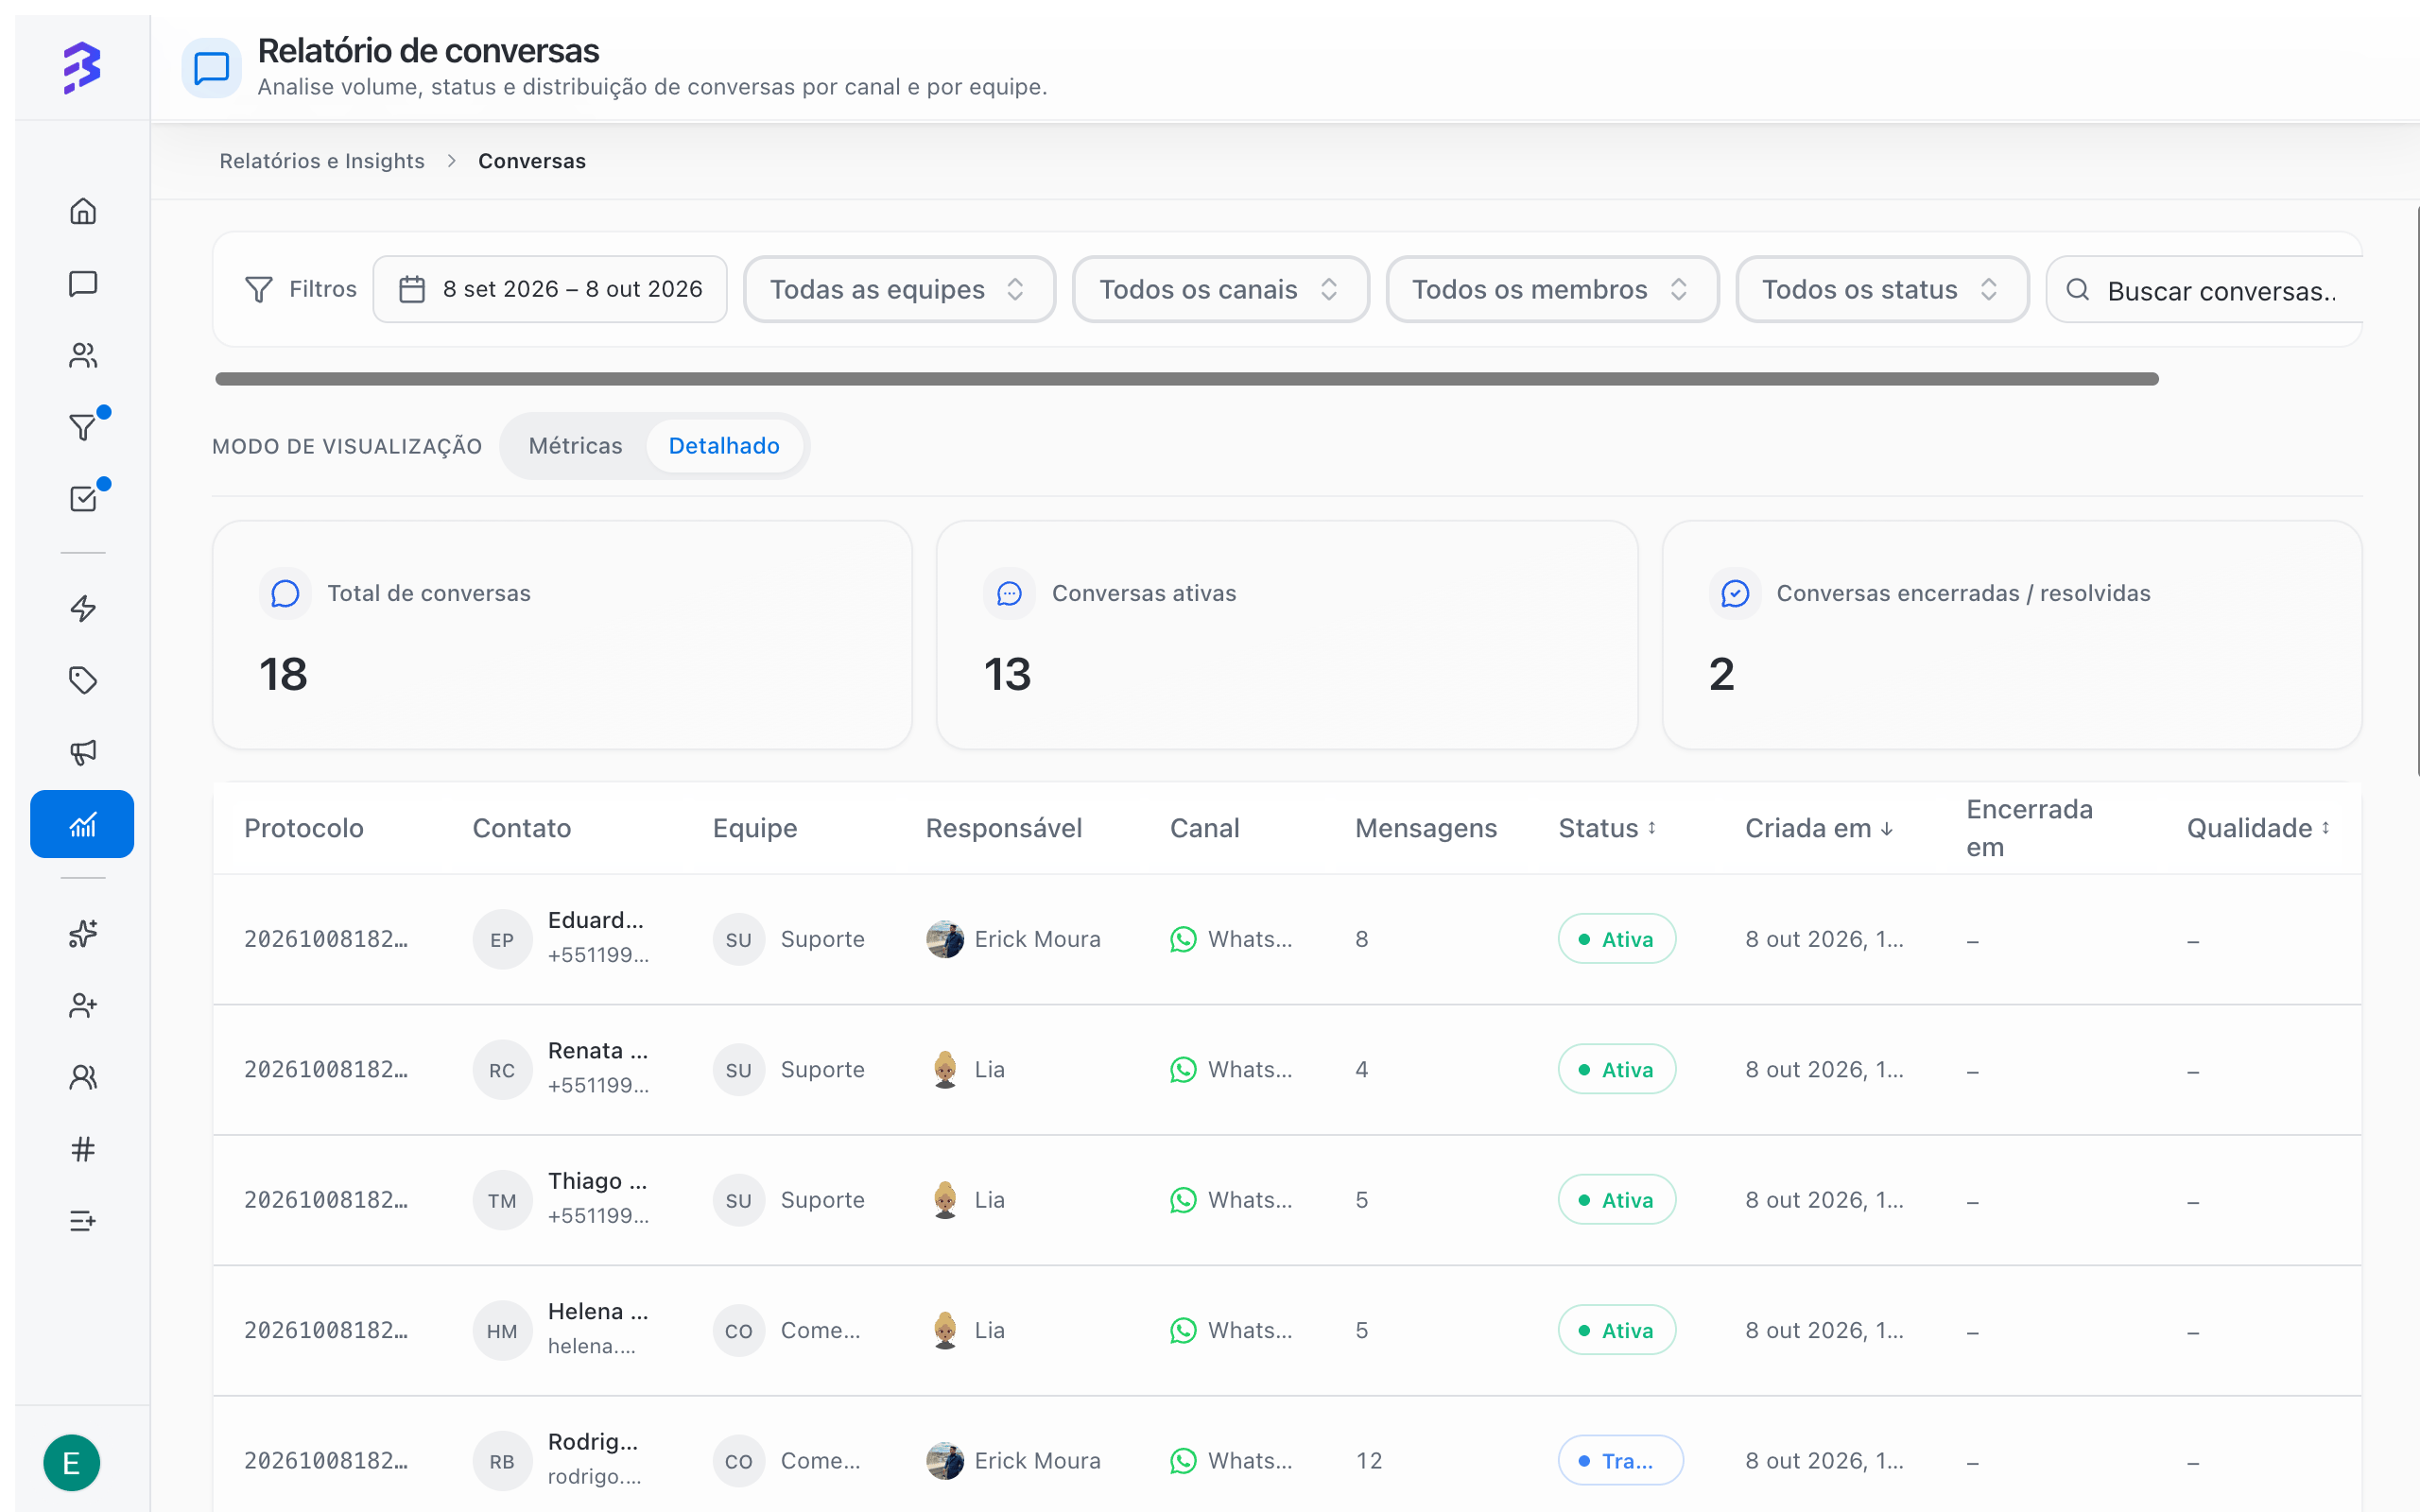
Click a row to open the conversation’s 360° View. 360° View and AI analysis →
How to read conversation types
Unassigned conversations
Unassigned shows conversations that arrived and stayed in the queue without anyone taking them. If the number grows:- Review the team’s distribution type (Round robin, Available or Queue).
- Check how many people are available at peak times.
- Link an AI agent to the channel to give the first response.
Limitations
- The report covers conversations from the teams and channels you can see.
- The Quality column only has a value for conversations where the AI analysis was generated.
- The heatmap shows hours in your time zone, which may differ from the time zone set in the Team Calendar.
Next steps
360° View and AI analysis
Open a conversation and evaluate the quality of the service.
Train the AI agent
Use what the report shows to improve the agent.